Spotlight Feature
2019 Packaging Outlook: Folding Carton & Corrugated Packaging
Part 3 of 6

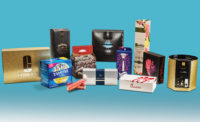
The folding carton industry prides itself on steady growth and stable earnings, much of which is based on the fact that most paper-based packaging is used for consumer staples. Nearly 60 percent of all paperboard packaging is destined for such food product segments as beverages and dairy products, candy and confections, dry foods including cereals, and frozen foods like meats and vegetables. The balance services these vital industries: pharmaceuticals, cosmetics and personal care products and soaps, household maintenance products, toys, sporting goods and most of the items found in grocery or club stores.
In 2017, the last year for which complete figures are available, the North American industry shipped 4.9 million tons of paperboard packaging with an average value per ton of $1,711, according to the Paperboard Packaging Council (PPC). This is nearly identical to the past few years; in 2016 and 2015, the industry shipped the exact same amount — 4.9 million. In 2016, the value per ton was $1,753, a slight decrease from 2015, which saw a value per ton of $1,765. So, while shipments have remained static, values have continued to slip. This trend is expected to change in the coming years.
After an uptick in number of employees in the industry, 2016 (the latest year for which complete figures are available) saw a slight downward turn. The industry lost 1,393 jobs over the course of the year, returning it closer to 2014 levels. Total payroll was returned to 2014 levels, as well — $2.05 billion.
The dollar value of shipments dropped for the third year in a row, and to its lowest point in more than a decade, from $8.59 billion in 2016 to 8.39 billion in 2017.
And while the numbers were weak in many areas for the folding carton market in 2017, in the five-year period between 2017 and 2021, the PPC expects the industry to grow at an average annual rate of 2.3 percent in sales, 0.4 percent in tons. The average value per ton per year is expected to make a turnaround, increasing by 1.9 percent.

RISI, an information provider for the global forest products industry, expects folding carton shipments to rise by 0.6 percent in 2018, while the outlook for the latter years of the forecast is even more positive; shipments are expected to increase at a 0.8 percent average annual rate over the next five years, peaking in 2019 at 1.8 percent.
RISI also predicts a macroeconomic slowdown in 2021, resulting in carton shipment declining by 0.2 percent after three years of moderate to strong growth. The total value of U.S. carton shipments should climb from an estimated $8.4 billion in 2017 to $10.0 billion in 2022, and while average values per ton have dipped the past three years, they are expected to grow by 2.7 percent throughout the forecast period.

Corrugated Packaging
Over the course of the past decade, the corrugated industry has made sustained growth, in marginal increments. For 2017, the last year for which final statistics are available, the industry again saw slight upward growth.
According to statistics compiled by the Fibre Box Association (FBA), corrugated shipments totaled 386 billion square feet in 2017, an increase of 2.5 percent from 2016, which recorded more than 376.4 billion square feet, a 2.1 percent increase over 2015’s 368.6 billion square feet.
The value of shipments increased to $33.1 billion, the eighth straight year of growth, and a healthy increase of 2016’s $30.8 billion. In 2015, the value of industry shipments increased to 30.5 billion, up from $29.8 billion in 2014.
When it comes to the general breakdown of the corrugated industry — corrugator plants vs. sheet plants — nothing has changed in more than a decade. Corrugator plants — companies with their own corrugated production machines — produce 80 percent of the industry shipments while sheet plants — companies purchasing corrugated sheets from a corrugator plant, which they then convert — produce 20 percent.
Production continued to inch upward, as well. The average corrugator plant manufactured 1,047 million square feet of combined board in 2017, compared with 2016 in which the average corrugator plant manufactured 1,010 million square feet of combined board. In 2015, the number was 968 million square feet, and in 2014, it was 947 million square feet.
Driven by the movement toward sustainability and environmental stewardship, the average basis weight of corrugated board dropped from 131.3 pounds per thousand feet in 2016 to 125.5 pounds per thousand square feet in 2017. Reducing basis weight has been on ongoing goal for the industry; in 2015 the average basis weight was 131.4 pounds per thousand square feet; and in 2014 it was 131.6 pounds per thousand square feet.
Single-wall corrugated board has long dominated in the industry. In 2017, it accounted for 90.7 percent of all production. This compares to 90.4 percent of all production in 2016.
Corrugated plants consumed 31.6 million tons of containerboard in 2017, a slight increase over 2016’s 30.8 million tons. In 2015, 30 million tons of containerboard were consumed, and in 2014, 29.5 million tons of containerboard were consumed.
Combined inventory levels at corrugator plants and mills, relative to consumption, increased from 3.5 weeks at December 31, 2016, to 3.6 weeks at December 2017.
For the first time in a number of years, despite continued industry consolidations, the number of industry plants remained almost identical year over year. In 2017, 1,154 industry plants were in operation — 460 corrugator plants and 694 sheets plants. This is almost identical to 2016, in which 1,155 plants were reported in operation.
For the second year in a row, the corrugated industry increased its workforce. In 2017, the number of employees in industry production was 57,432. In 2016, 57,075 workers were employed in the industry.
Another positive sign for the corrugated industry comes in the form of workforce productivity. Productivity in 2017 was 3,910 square feet per production man-hour, which is a sizable increase over 2016 in which productivity was 3,790 square feet per production man-hour, up from 3,670 square feet per production man-hour in 2015.
Packaging Outlook 2019 Articles:
|
Looking for a reprint of this article?
From high-res PDFs to custom plaques, order your copy today!


