Evaluating your profits
Using new metrics in the packaging industry to increase profitability

Many companies have hundreds or thousands of different SKUs. Variety in product lines is necessary, because clients and consumers demand it. But, at what point does variety become too much? Offering every possible size combination, variety, and color may lead to operational problems. Varying run lengths, job changes and equipment changes also add complexity and inefficiencies to the operation and utilization of assets. More products do not always lead to more profit, and in fact, may lead to less.
Faced with tighter margins, increased competition, and slow organic growth, the food and beverage packaging industry has the unique challenge of analyzing an often unwieldly product mix to achieve higher levels of profitability. In these situations, using new, more granular metrics to gain additional insights can make a big difference to a company’s profitability.
All manufacturers know their unit margins and use that as a standard guide in day-to-day decisions. But very few know how quickly they are making money from their large investments in plant and equipment. Getting that enhanced insight into profit per machine hour and ROA for a specific customer order, or a product at the SKU level, can be a real challenge.
Traditional manufacturing cost metrics based on unit margin can be augmented with one crucial missing metric – profit velocity – or profit per unit of time. Driven by "big data," the food and beverage industry is now capable of taking a deeper look at profit metrics, and can better balance their product mix to increase profits. The profit velocity metric goes a step beyond traditional profit analysis based on unit margin. It enables a view of the profit-per-hour impact of changes to the product, customer and asset mix of every operating decision.
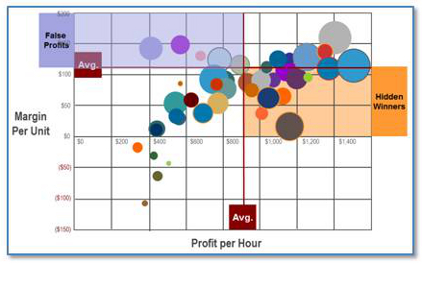
The most profitable SKUs are not always the most obvious ones. Omitting the profit velocity factor from metrics may cause incorrect conclusions– resulting in putting more emphasis on products or customers that are not as profitable – sometimes known as ‘false profits.’ Another obvious consequence of this type of analysis is that it may overlook products or customers that are yielding a higher cash contribution per hour, sometimes know as ‘hidden winners.’ As demonstrated in the figure below, this usually results in these more profitable products getting less attention.
Robert Kugel, Senior Vice President and Research Director at Ventana Research says, “Companies in industries such as specialty chemicals, packaging, integrated steel mills and silicon chip fabrication (to name just four) routinely fail to make the right decisions about pricing, production and sales management because they use analytic methods that, from an economic perspective, present a distorted measure of profitability.”
The profit velocity metric has particular applications in the food and beverage packaging industry, which tends to have a high mix of products. Achieving the right production mix is essential in this environment. And, getting a handle on profit-per-machine-hour consumed for each individual unit gives packaging company new insights, and the ability to maximize cash contribution.
Further, the time-based profit velocity metric, which can be viewed through interactive analytics, is essential in a fast moving market environment. Analyzing profit per hour, in addition to just profit per unit, produces a much richer and more granular view of profitability. It can significantly increase cash contribution and ROA while maximizing the use of existing production equipment.
As an example, a $5 billion packaging manufacturer was able to increase operating margins from 11% to 16%, and increase annual operating profit by $88 million, in two years by applying the PV metric. This strategy was exceptionally useful during a time when the economy was sluggish. The company, which had over 4,000 products and a complex manufacturing environment, had been analyzing in detail traditional metrics relating to unit margins, but this had proven inadequate in maximizing profit. The company's executives had discovered that profits with the highest unit margins weren't always the most profitable.
By calculating the profit generated per production hour for each product, they were able to identify products with high unit margins, but low profit per hour; and also low unit margin products that had a faster production time and consequently a higher average profit per hour. The results were dramatic, and by generating greater profits from lower volumes, the company was able to reduce overhead and reallocate capacity to products that generated profits more quickly.
Asking the simple question, "How much profit is each product or customer generating per machine hour" can add clarity to the challenge of optimizing product mix. Using profit velocity analysis in daily operating decisions can deliver significant improvements in cash contribution without investing any additional money in plant and equipment.
 Scott Murchison is the Managing Director of Profit Velocity Solutions, a San Francisco-based technology company that has pioneered a unique integrated profit platform called PV Accelerator™. He was formerly the Vice President and General Manager for the Beverage Packaging and Foodservice Division of International Paper, and President of Owens, Illinois, North America.
Available only through its global network of consulting firm alliance partners, PV Accelerator reveals new insights to drive continuous profit improvement. By supplementing traditional profit-per-product-unit margin analysis with the previously unavailable “missing metric” of profit-per-machine-hour, high mix manufacturers can tap previously hidden opportunities to accelerate cash flow and achieve major gains in annual profit and ROA. Learn more at www.profitvelocitysolutions.com
Looking for a reprint of this article?
From high-res PDFs to custom plaques, order your copy today!


