


The 2019 state of the industry report, recently released by the Flexible Packaging Association (FPA), provides industry converters, suppliers, investors, and analysts with insight into the performance of the U.S. flexible packaging industry over the past year. This definitive source of data and information also examines several other aspects of the industry including:
- Performance (growth, revenue/volume expectations, prof- itability, capital spending)
- Materials and processes (printing, expected material usage)
- End-uses (end-use forecast, U.S. Census Bureau retail segments data)
- Structure and consolidation (M&A activity)
- Imports and exports (trade outlook)
- Industry vision, challenges, and critical issues
The report covers the entire flexible packaging industry, including the segment of the industry that adds significant value to the flexible materials, usually by performing multiple processes. This segment of the industry is estimated to be $24.8 billion for 2018 and does not include retail shopping bags, consumer storage bags, or trash bags.
Over the next few months, the FPA Update will include reviews of key sections within the 2019 report. Following is an overview of the “Industry Performance” and “Materials & Processes” sections of the report.
U.S. Flexible Packaging Industry Performance
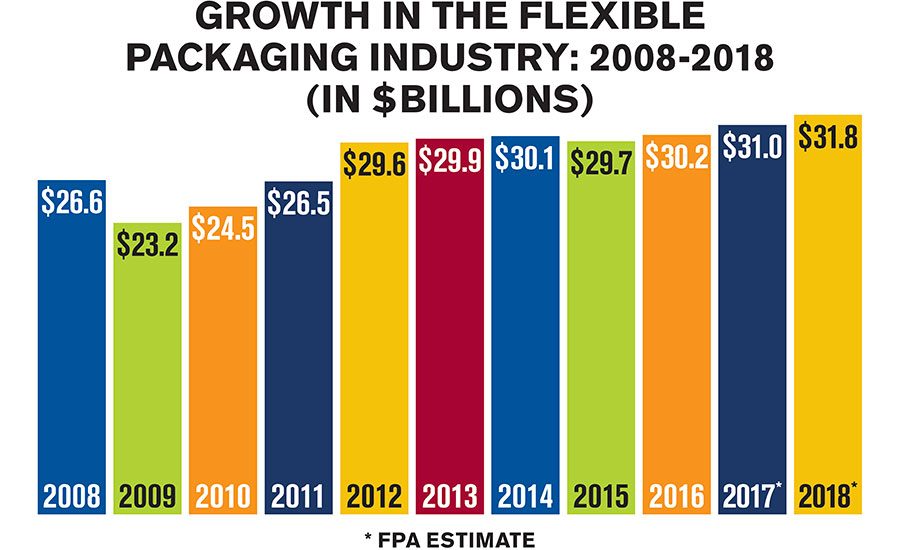
The total U.S. flexible packaging industry is estimated to be $31.8 billion in annual sales for 2018. The flexible packag- ing industry includes packaging for retail and institutional food and non-food, medical and pharmaceutical, industrial materials, shrink and stretch films, retail shopping bags, consumer storage bags, and wraps and trash bags.
Flexible packaging represents approximately 19 percent of the total $170 billion U.S. packaging industry and is the second largest packaging segment behind corrugated paper, and just ahead of bottles and miscellaneous rigid plastics packaging. Flexible packaging’s solid long-term strength coupled with flexibles’ ability to replace other packaging formats has result- ed in the growth of U.S. flexible packaging, increasing from 17 percent in 2000 to the current level of 19 percent in 2018. sales revenue is expected to increase 2.4 percent to almost $32.5 billion with volume projected to be somewhat lower. Looking out 3-5 years, converter expectations for sales revenue are projected to rise about 3 percent to 5 percent per year and volume to increase about 5 percent to 6 percent per year.
Materials & Processes
Flexible packaging companies utilize several materials and processes to produce flexible packaging. Film, sheet, and plastic resins account for 70 percent of the materials used in the U.S. flexible packaging industry. Inks and paper account for approximately 6 percent each and foil, coatings, and adhesives account for approximately 4 percent each. The report details that PE (polyethylene) film is used by 87 percent of survey respondents, and accounts for 49 percent of total film use. PE resin is used by 94 percent of survey respondents and accounts for 87 percent of total resin use.
Survey data also shows that converters print from 2 to 10 colors with an overall average of 7.3 colors. FPA survey data from 2016-2018 indicates that average direct material costs have ranged from 53 percent to 55 percent of net sales and operating profit has been in the range of 7 percent to 8 percent of net sales for 2016-2018. The total number of presses was estimated at 3,000 including flexographic, gravure, in-line, offset, and other simple presses. Survey results indicated that 12 percent of respondents used digital printing in 2018, up from 8 percent in 2017.
FPA gathers the information contained in the report through several reliable industry sources, including the FPA members’ State of the U.S. Flexible Packaging Industry Survey; the FPA non-members’ Industry-Wide Converter Survey; the Annual Survey of Manufactures (ASM), published by the U.S. Census Bureau; the U.S. Department of Labor; the U.S. Department of Commerce; industry analysts; and investment banking reports. Data collected from these sources provides a more complete picture of the U.S. flexible packaging industry and helps to crosscheck information regarding industry size, structure, market segments, and key packaging products.
For more information on the FPA 2019 State of the Flexible Packaging Industry Report, contact FPA’s Business & Economic Research Division, at fpa@flexpack.org or 410-694- 0800, or visit www.flexpack.org.


